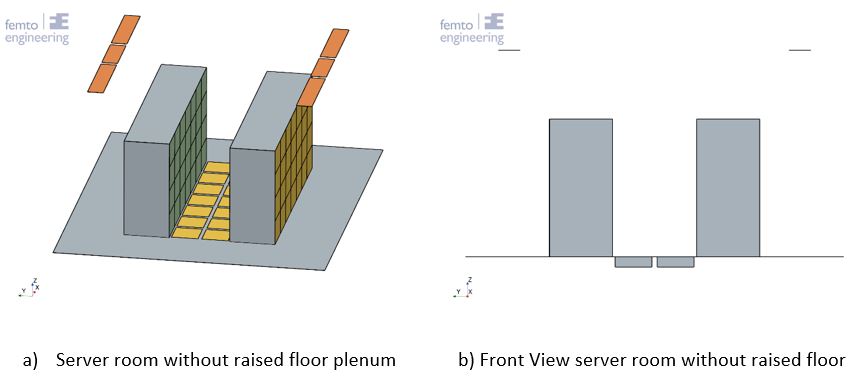
Data center comparison CFD STAR CCM+ with paper pt 2 - Femto Engineering - Femto Engineering

Data center comparison CFD STAR CCM+ with paper pt 2

In the previous article we compared a simple data center with results from two papers, namely the paper by (Fernando, Siriwardana, & Halgamuge, 2012) and the paper by (Nada, Said, & Rady, 2016). This data center only contained the top part, not including the raised floor plenum.

Click here for the first article!

This article will perform a comparison between the second part of the paper by (Nada, Said, & Rady, 2016). This means that the raised floor plenum will be included in the simulations. The simulations are split into two parts. In the first part the raised floor plenum is first simulated up until the perforated tiles. Then the mass flow found in the first simulation is used in the second simulation where the geometry only contains the server room and the perforated tiles. This is similar to how the simulation was performed by Nada et. al. In the second part the whole data center room is simulated in one go, thus including both the server room and the raised floor plenum.

This article will not only compare the simulation with the paper by (Nada, Said, & Rady, 2016) but also see what the effect is of performing the simulation of the raised floor plenum separately to the simulation of the data center as a whole.

Geometry

In line with the paper a data center room with dimensions 6.71 x 5.49 x 3.0 m was created. Within this room 14 racks with dimensions 0.61 x 0.915 x 2.0m were added, where each rack consists of 4 servers with dimensions 0.61 x 0.915 x 0.5 m. The 14 racks are separated into two rows of 7 racks each which are 1.22m from each of the four walls as well as 1.22m from each other. 14 perforated tiles were added in between the racks where the cold aisle is located. The tile dimensions are 0.534 x 0.534 x 0.15 m.

In the roof of the data center above the hot aisle, six natural ventilation units were present where hot air can leave the room.

The raised floor plenum was created over the same width and length as the room above and a height of 0.6m. However, on both sides a Computer Room Air-Conditioning (CRA/C) outflow was added. This CRA/C unit outflow has a height of 0.6m, which is the same as the raised floor plenum. The width of the CRA/C outflow is 3.33m, creating a surface area which is similar to the surface area of the perforated tiles.

Physics

The 3D simulation was run using an ideal gas and gravity as well as segregated temperature to account for the differences in buoyancy of cold and warm air. Furthermore, turbulence was modelled using the realistic two-layer k-ε  turbulence model.

Boundary conditions

Figure 1: Data center set-up for all three simulations (only the server room, figure a and b, only the raised floor plenum, figure c, complete data center, figure d )

In Figure 1 the colours display the different boundary conditions. For the first part of the simulations the CRA/C inlet underneath the raised floor plenum is a velocity inlet (indicated in red), while the tiles (shown in orange) are pressure outlets. The perforated tiles in the server room are mass flow inlets, where the mass flows found on the pressure outlets in the first simulation are used.

The boundary conditions of the second simulation, where the raised floor plenum and the server room are simulated in one go are similar. However, in this case the perforated tiles are connected to the raised floor plenum, negating the need for a pressure outlet on the tiles. The tiles are modelled as a porous medium.

The simulation settings were matched to the paper as much as possible. The settings are summarized in Table 1.

Table 1: Data center CFD model boundary conditions (Nada, Said, & Rady, 2016)

Porous media

For the second simulation, the porous medium resistance has to be imposed on the tiles. A body force was calculated within the paper to account for the change in momentum through the tile compared to an open tile.

Equation 1

Where V is the body force computational volume, ρ is the density of air, Q is the fully open tile air flow rate in m3/s, σ is the opening ratio and A is the fully open area in m2 (Nada, Said, & Rady, 2016).
In Siemens Simcenter STAR CCM+ a porous medium can be used to account for a partly open geometry. The porous medium makes use of a viscous and inertial resistance, which can be computed as follows:

Equation 2

Where ΔP is the pressure drop through the geometry in Pa, t is the thickness of the geometry in m, a is the inertial resistance value in kg/m4, β is the viscous resistance value in kg/m3-s and v is the velocity in m/s. By substituting Q = Av and ΔP = F/A in equation 1, an equivalent relation for equation 2 can be found.

Equation 3

Since there is only one term containing the velocity squared, it can thus be assumed that β = 0, thus the viscous resistance is zero. Furthermore, it was assumed that the flow through both the servers and the perforated tiles is moving in a single direction (z-direction for the perforated tiles and y-direction for the servers) and cannot move in any other direction (see Figure 2).

Servers

Each server is modelled as a porous medium, as described above. Each server is given a constant total heat production of 875W over the full volume.

Results

Comparing the mass flow through the tiles shows quite a big difference if a porous medium tile is used which is directly connected to the server room or if the raised floor plenum is modelled separately from the server room.

If the raised floor plenum is modelled separately a good match is found in mass flow behaviour through each of the tiles compared to the paper. The middle tile gets the highest mass flow. Whereas the mass flow decreases when moving to the tiles closer to the CRA/C units. However, when modelling the tiles as a porous medium in between the raised floor plenum and the server room it is visualized that the mass flow through each of the tiles is constant. This indicates that the resistance produced due to the tile perforation has a much higher influence on the distribution of the mass flow through the tiles than the location of the tile with respect to the CRA/C unit.

This result indicates that the assumption made in the previous article, where each tile had a constant mass flow into the server room, is correct.

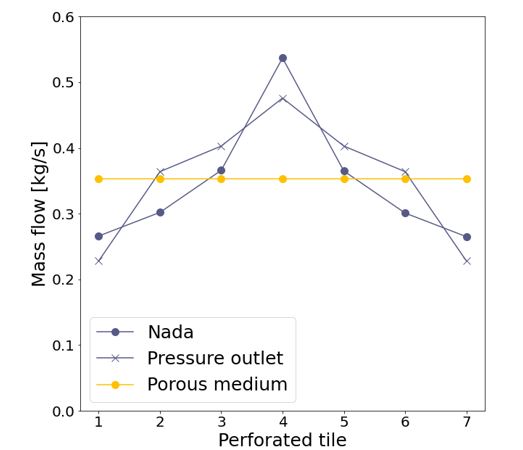
Figure 2: comparison in mass flow

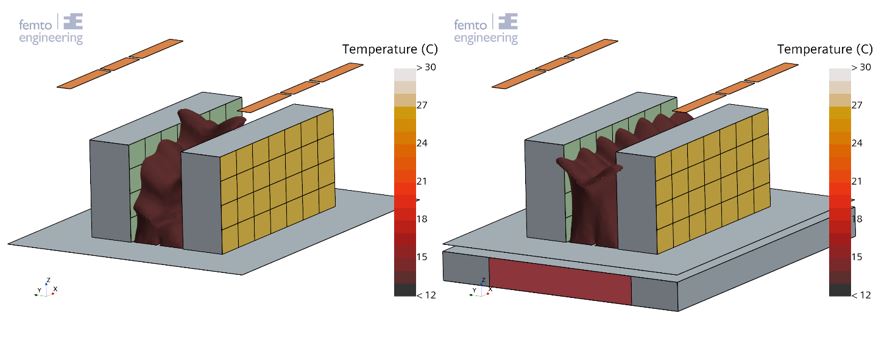
Figure 3: Isosurface at 13C; left: separate simulations, right: single simulation

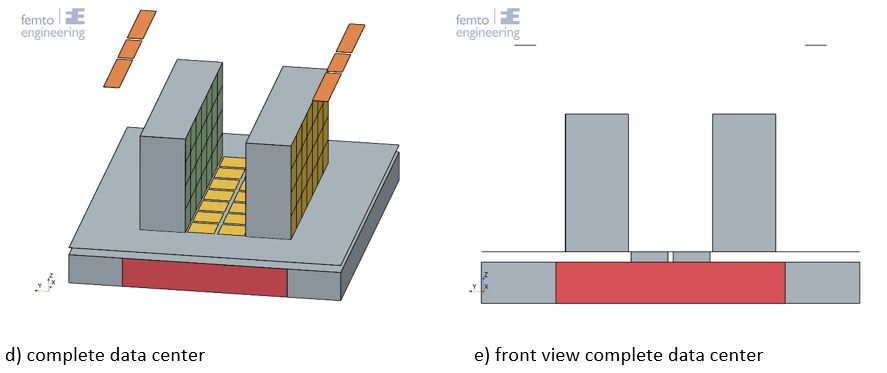
In Figure 3 a comparison is drawn between the temperature isosurface for 13C. On the left the isosurface is shown for the simulation where first the area below the raised floor is run and then the simulation for the server area. On the right the isosurface is shown for the same simulation but now the entire data center is simulated in one go. It is visible that the isosurface on the left shows the same curve as was shown in the graph, Figure 2. The isosurface on the right however shows a wave-like behaviour. Where a lower temperature reaches a higher location where the tiles blow cold air into the server room, and the temperature rises slightly between the tiles.

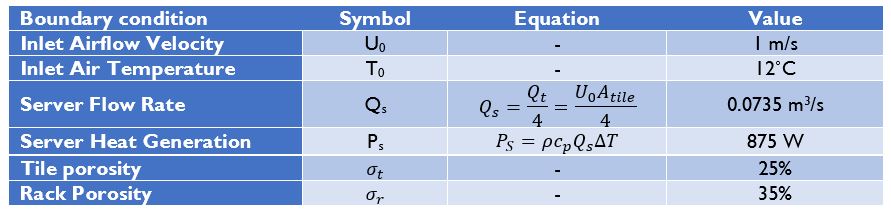
The more constant distribution of temperature over all server racks in the simulation where a constant inflow through the perforated tiles is present compared to the simulation where the inflow through the tiles increases towards the middle of the server racks is shown in Figure 4. The simulation where only the server room is simulated has the highest temperature at 29.7C in the hot aisle top corners of the two rack rows (as shown in Figure 5a). The maximum temperature in the simulation of the full data center is a full degree lower at 28.7C. This temperature is located at the top corners of the middle server rack, as shown in Figure 5b.

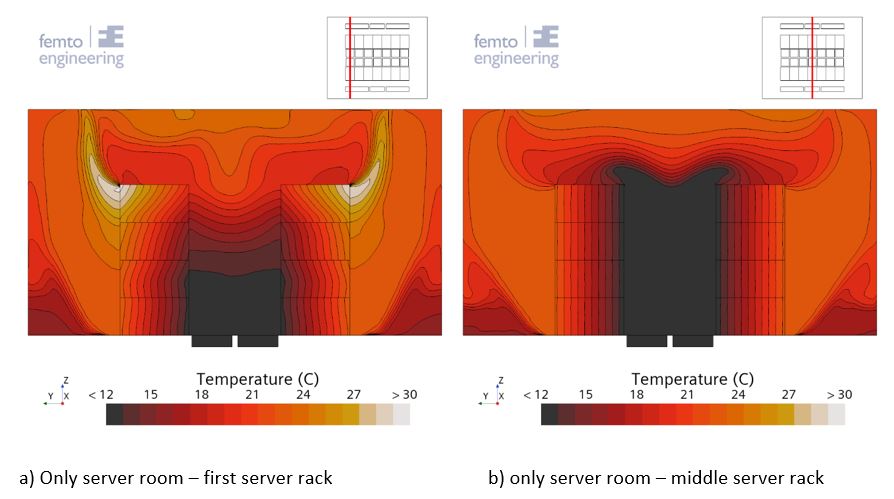
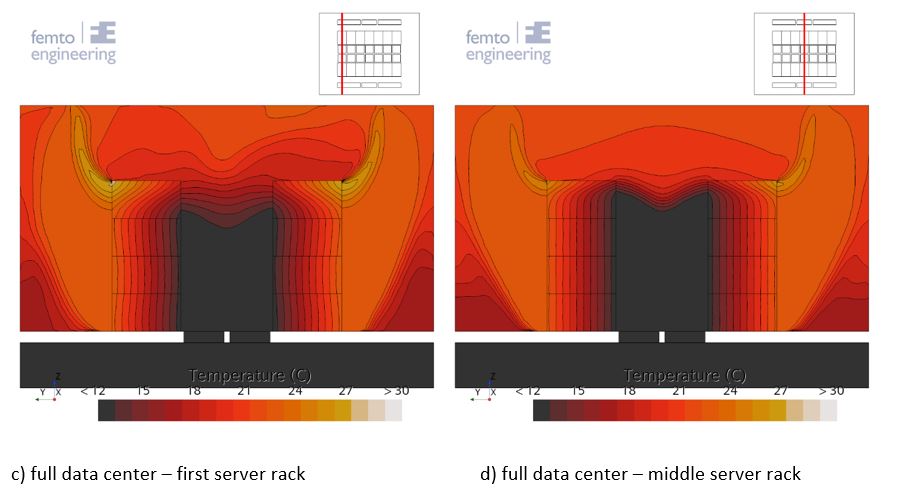
Figure 4: rack temperature distribution comparison

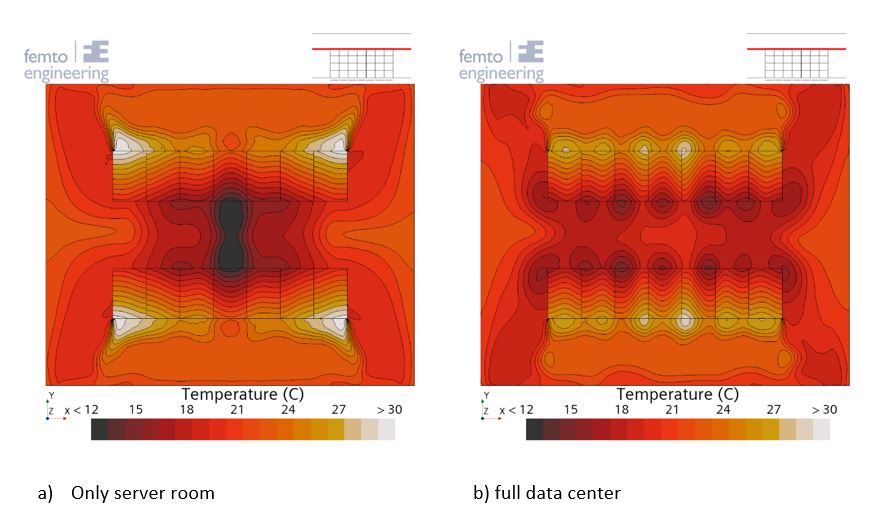
Figure 5: temperature distribution at Z = 1.95m

Conclusion

The mass flows found in the paper written by Nada et. Al. could be reproduced. However, it was found that a constant mass flow distribution through the perforated tiles was more in line with the effect found when simulating the entire data center. This also leads to lower maximum temperatures in the data center.

Bibliography

Fernando, H., Siriwardana, J., & Halgamuge, S. (2012). Can a Data Center Heat-Flow Model be Scaled Down? 2012 IEEE 6th International Conference on Information and Automation for Sustainability (pp. 273-278). Beijing, China: IEEE. doi:10.1109/ICIAFS.2012.6419916.

Nada, S. A., Said, M. A., & Rady, M. A. (2016, June). CFD investigations of data centers’ thermal performance for different configurations of CRACs units and aisles separation. Alexandria Engineering Journal, 55(2), 959-971. doi:10.1016/j.aej.2016.02.025


April 25, 2023
get in touch

Do you need more information or want to discuss your project? Reach out to us anytime and we’ll happily answer your questions.

about us

At Femto Engineering we help companies achieve their innovation ambitions with engineering consultancy, software, and R&D.
We are Siemens DISW Expert Partner for Simcenter Femap, Simcenter 3D, Simcenter Amesim, Simcenter STAR-CCM+ and SDC verifier. Get in touch and let us make CAE work for you.

Privacy policy

×

Be ahead in FEA & CFD

Sign up for our newsletter to get free resources, news and updates monthly in your inbox. Share in our expertise!