Data center comparison CFD STAR CCM+ with paper - Femto Engineering - Femto Engineering

Data center comparison CFD STAR CCM+ with paper

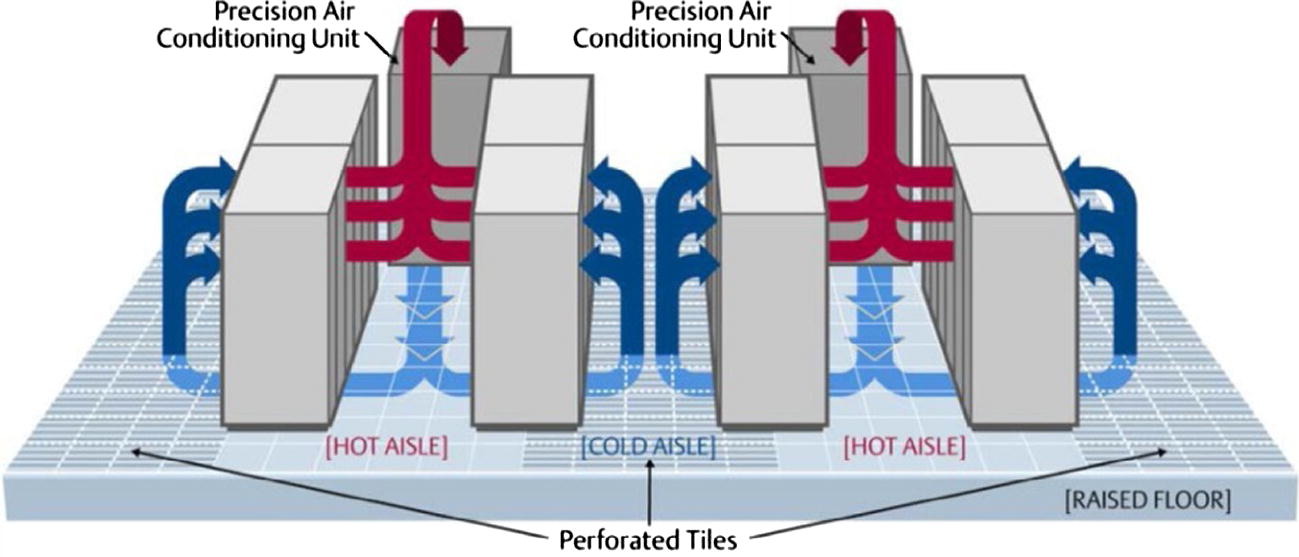
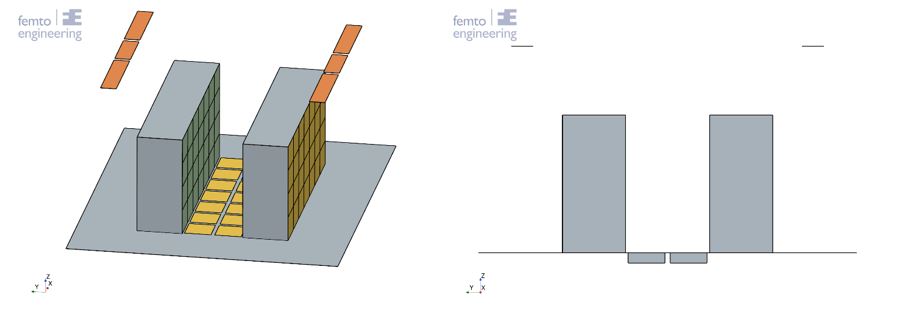
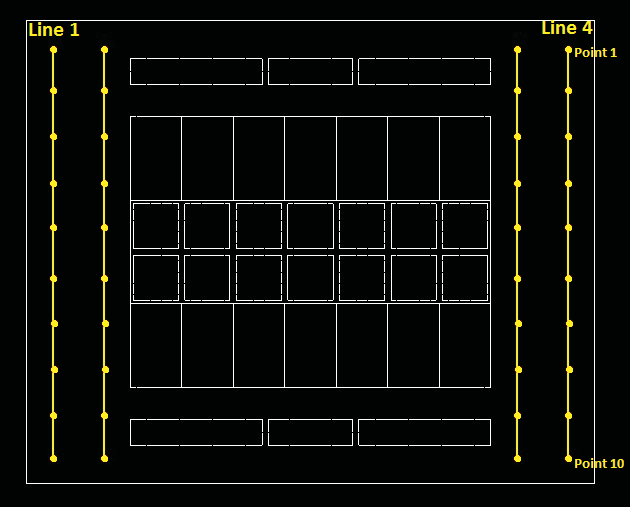
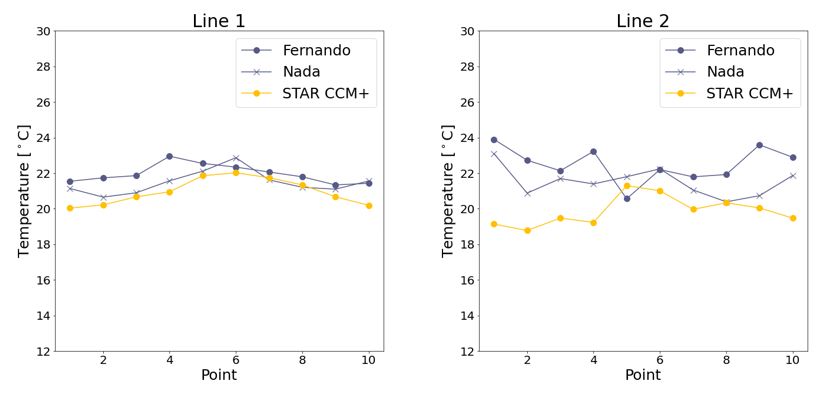
In this article we have compared a simulation of a data center with a similar simulation performed by (Fernando, Siriwardana, & Halgamuge, 2012). This paper introduces a data center containing 14 racks with 4 server units each. It researches the effect of scaling of a data center on the cooling within the data center. Another paper was used as well, namely (Nada, Said, & Rady, 2016), which reproduced the results from (Fernando, Siriwardana, & Halgamuge, 2012) as well as researching the effect of different types of Computer Room Air Conditioning (CRAC) configurations as well as a closed and an open cold Aisle.

A schematical overview of a typical set-up of a data center is shown in Figure 1.The geometry and setup used in the used reference papers, is reproduced in Siemens Simcenter STAR CCM+ 2302, the results of which are described in this article. The first part contains the reproduction of the paper by (Fernando, Siriwardana, & Halgamuge, 2012) which is also reproduced by (Nada, Said, & Rady, 2016).

Figure 1: Example of a typical data center (Cho, Lim, & Kim, 2009)

Geometry

In line with the reference paper, a data center room with dimensions 6.71 x 5.49 x 3.0 m was created. Within this room 14 racks with dimensions 0.61 x 0.915 x 2.0m were added, where each rack consists of 4 servers with dimensions 0.61 x 0.915 x 0.5 m. The 14 racks are separated into two rows of 7 racks each which are 1.22m from each of the four walls as well as 1.22m from each other. 14 perforated tiles were added in between the racks where the cold aisle is located. The tile dimensions are 0.534 x 0.534 x 0.15 m.

In the roof of the data center above the hot aisle six natural ventilation units were present where hot air can leave the room.

Physics

The 3D simulation was run with a segregated flow solver for the flow and energy equations. The air is modelled as an ideal gas and gravity is included in the model to account for the differences in buoyance of cold and warm air. Furthermore, turbulence was modelled using the realistic two-layer k-  turbulence model. The tiles in the floor are modelled as a porous medium.

Boundary Conditions


Figure 2: Data center set-up

In Figure 2 the set-up of the data center is shown. The perforated tiles (underneath the yellow surfaces) have a mass flow inlet on one side and an interface with the server room (in yellow) on the other side. The green surfaces are where a mass flow through the servers is forced. The orange surfaces at the top are pressure outlets, where the hot air can leave the server room through the roof.

The simulation settings were matched to the paper as much as possible. The settings are summarized in Table 1. The tile flow rate and the server flow rate were put directly on the tile openings and the server inlets on the side of the cold aisle.

Table 1: Date center CFD model boundary conditions (Nade, Said, & Rady, 2016)

Porous media

A body force was calculated within the paper to account for the change in momentum through the tile compared to an open tile.


equation 1


Where V is the body force computational volume, ρ is the density of air, Q is the fully open tile air flow rate in m3/s, σ is the opening ratio and A is the fully open area in m2 (Nada, Said, & Rady, 2016).

In Siemens Simcenter STAR CCM+ a porous medium can be used to account for a partly open geometry. The porous medium makes use of a viscous and inertial resistance, which can be computed as follows:


equation 2


Where  is the pressure drop through the geometry in Pa, t is the thickness of the geometry in m, a is the inertial resistance value in kg/m4, β is the viscous resistance value in kg/m3-s and v is the velocity in m/s. By substituting Q=Av and ΔP=F/A in equation 1, an equivalent relation for equation 2 can be found.


equation 3


Since there is only one term containing the velocity squared, it can thus be assumed that β=0, thus the viscous resistance is zero. Furthermore, it was assumed that the flow through both the servers and the perforated tiles is moving in a single direction (z-direction for the perforated tiles and y-direction for the servers) and cannot move in any other direction (see Figure 2).

Servers

Each server is modelled as a porous medium, as described above. Each server is given a constant total volumetric heat production of 875W over the full volume.

Model validation

The model is validated using the same datapoints to describe the temperature as used in both papers. The temperature probes are visualized in Figure 2.

Figure 3: Temperature probes (Fernando, Siriwardana, & Halgamuge, 2012)

Results

Figure 4: Line 1 and 2 comparisons (Fernando, Siriwardana, & Halgamuge, 2012) (Nada, Said, & Rady, 2016)

In Figure 4 the plots of the comparison between the temperature results of the temperature on line 1 and line 2 are shown. The temperatures in the data points show that the temperature increases from 12 degrees Celsius on the inlet to about 22 degrees in the data center. From these plots it can be concluded that the temperature found within STAR CCM+ is in line with the results found in both papers. However, the temperature, especially on line 2, is a little lower than those found in the papers. This is most likely due to the different methods used, with using a porous medium instead of a momentum sink and a volume heat source instead of a surface heat source.

The temperature distribution at the first rack and at the middle rack is shown in Figure 5. The maximum temperature in the server room is reached on the outer racks. Due to the tiles not being connected the temperature shows a somewhat wavy behaviour, where the minimum temperature front reaches higher just above a tile and is lower around the middle of the tile where there is a floor. This behaviour is visible both in Figure 5 and in Figure 6.

Figure 5: server rack front view temperature distribution

Figure 6: Temperature distribution at z = 1.75m


Conclusion

Although the temperature is approached within the simulation compared to the results as produced by Fernando et. al. and Nada et. al. the temperatures found within this simulation were lower. It is possible that this is due to the different setup, both within the momentum source as well as the heat production technique used for the servers.

Bibliography

Cho, J., Lim, T., & Kim, B. S. (2009, October). Measurements and predictions of the air distribution systems in high compute density (Internet) data centers. Energy and Buildings, 41(10), 1107-1115. doi:10.1016/j.enbuild.2009.05.017

Fernando, H., Siriwardana, J., & Halgamuge, S. (2012). Can a Data Center Heat-Flow Model be Scaled Down? 2012 IEEE 6th International Conference on Information and Automation for Sustainability (pp. 273-278). Beijing, China: IEEE. doi:10.1109/ICIAFS.2012.6419916.

Nada, S. A., Said, M. A., & Rady, M. A. (2016, June). CFD investigations of data centers’ thermal performance for different configurations of CRACs units and aisles separation. Alexandria Engineering Journal, 55(2), 959-971. doi:10.1016/j.aej.2016.02.025


April 18, 2023
get in touch

Do you need more information or want to discuss your project? Reach out to us anytime and we’ll happily answer your questions.

about us

At Femto Engineering we help companies achieve their innovation ambitions with engineering consultancy, software, and R&D.
We are Siemens DISW Expert Partner for Simcenter Femap, Simcenter 3D, Simcenter Amesim, Simcenter STAR-CCM+ and SDC verifier. Get in touch and let us make CAE work for you.

Privacy policy

×

Be ahead in FEA & CFD

Sign up for our newsletter to get free resources, news and updates monthly in your inbox. Share in our expertise!