Simcenter Amesim | Sea routing and speed comparison - Femto Engineering - Femto Engineering

Simcenter Amesim | Sea routing and speed comparison

Marine simulation – Sea routing and speed comparison

The rising fuel prices and ongoing efforts to minimize the environmental impact makes reducing fuel consumption one of the main challenges in maritime sector. Simcenter Amesim models can be used within the design process to evaluate drivetrain alternatives and during operations to compare sea routes based on expected weather conditions.

Examples of design compressions

  • Hull and propeller: predicting vessel resistances and performances of the propulsive system
  • Propulsion architecture: diesel mechanical, diesel mechanical assist, diesel on demand, hybrid.
Ship trajectory form port of Hamburg to New Jersey

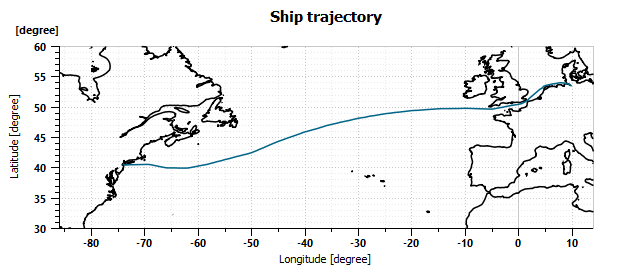
Figure 1: Ship trajectory form port of Hamburg to New Jersey

Amesim in marine

This article gives an example on how Simcenter Amesim could assist during operations. A cargo ship is about to leave the port of Hamburg with and has New Jersey as destination. The following questions need to be answered when planning the trip:

  • What would be the Estimated Time of Arrival (ETA)?
  • What is the expected fuel consumption?
  • How are these influenced by the weather conditions?

Simcenter Amesim simulation model. The engine model and control on the left, the propeller, ship, and sea conditions on the right.Figure 2: Simcenter Amesim simulation model. The engine model and control on the left, the propeller, ship, and sea conditions on the right.


The Amesim model

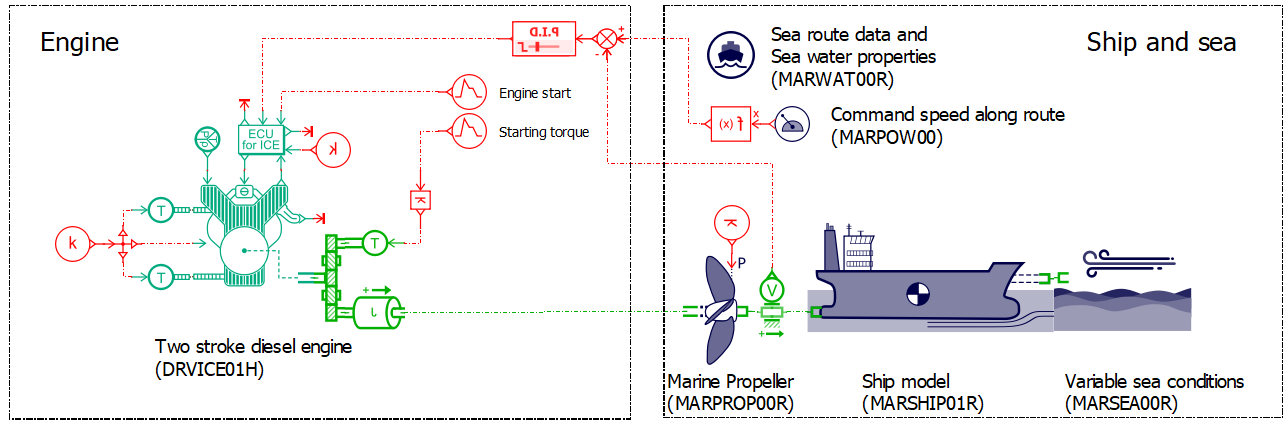
Within Simcenter Amesim a model of the ship is constructed (Figure 2). The main components are:

  • Two stroke diesel engine
    Engine performance are based on user-defined mappings.
  • Propeller designed for marine application
    In this model, the thrust and torque are computed using 2D tables of the Ct (thrust coefficient) and Cq (torque coefficient) as function of the pitch diameter ratio and advance angle defined on 360° (all four quadrants). Other options are 2D tables for the first and fourth quadrants or first quadrants only and the theoretical Wageningen B-Series propeller model.
    The influence of the hull on the wake is omitted in this analysis, but can be included and computed with Taylor, Holtrop, Harvald, user defined.
  • Ship model considering mass and navigation resistance
    The model determines the longitudinal translational motion of a ship and takes into account its mass and the navigation resistance due to the friction with water. The navigation resistance is computed based on experimental test data of a ship model. The empirical formulas of ITTC 78 methodology are used to scale the result to the real ship dimensions. Other ways to determine the navigation resistance are Statistical Barrass, Holtrop and Mennen method, Savitsky Method, user defined as function of ship velocity.

Varying sea conditions along the sea route are accounted for by apply two levels of representative weather conditions (good and bad). These levels have been established taking the average weather you may encounter on the travel and are split into two extreme levels. Figure 3 and 4 show the varying conditions.

Basic seawater properties for good and bad weather conditions

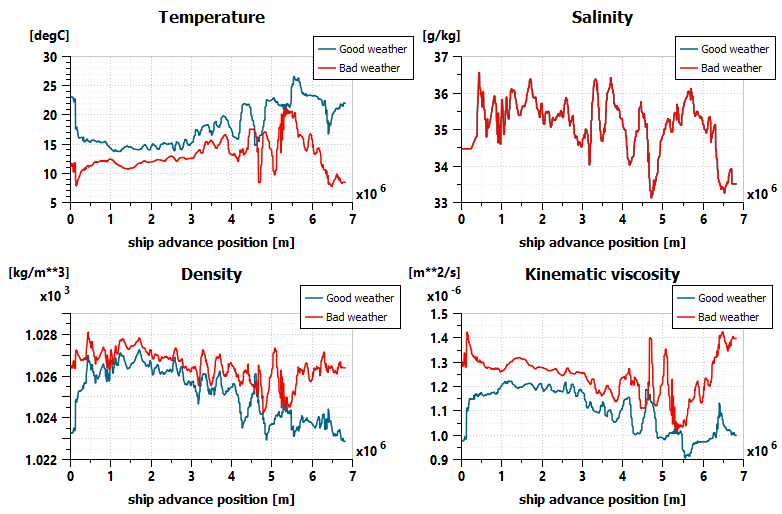
Figure 3: Basic seawater properties for good and bad weather conditions

Wand and wave properties for good and bad weather conditions

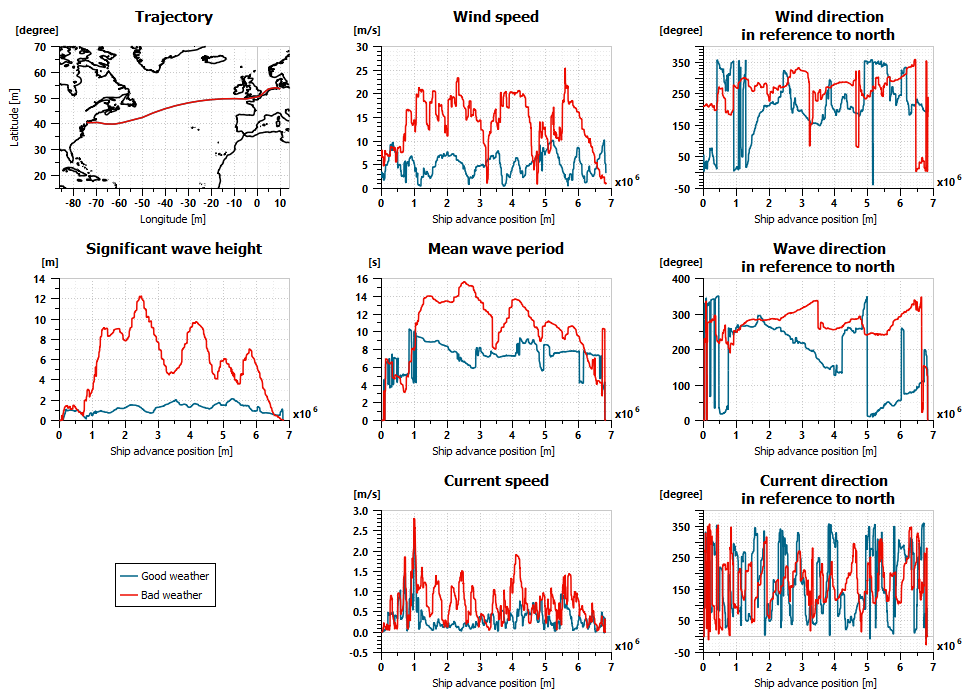
Figure 4: Wind and wave properties for good and bad weather conditions

Conditions

Three different command speed profiles are imposed. Based on the two levels of expected conditions and three different cruising speeds a total of six simulations are performed to determine the travel times, fuel consumptions and CO2 emissions. Figure 5 shows the real ship speed compared to the command speed. For good weather conditions the real speed follows the 8 and 11knot command speed. However, the real speed does not follow the max speed command due to the maximum load reached by ship engine. For bad weather conditions, the maximum real speed even drops below 11knot and 8knot along the route.

Commanded speed profiles and real ship speeds

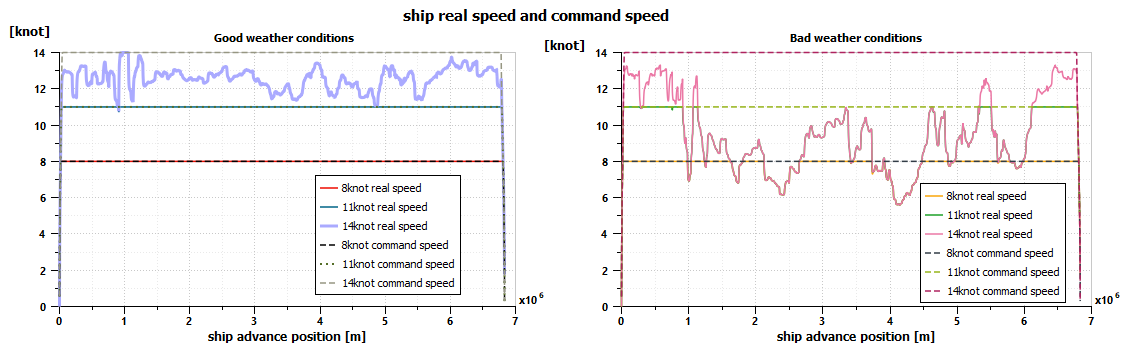
Figure 5: Commanded speed profiles and real ship speeds

Sea resistances of different sources for good (top row) and bad weather conditions

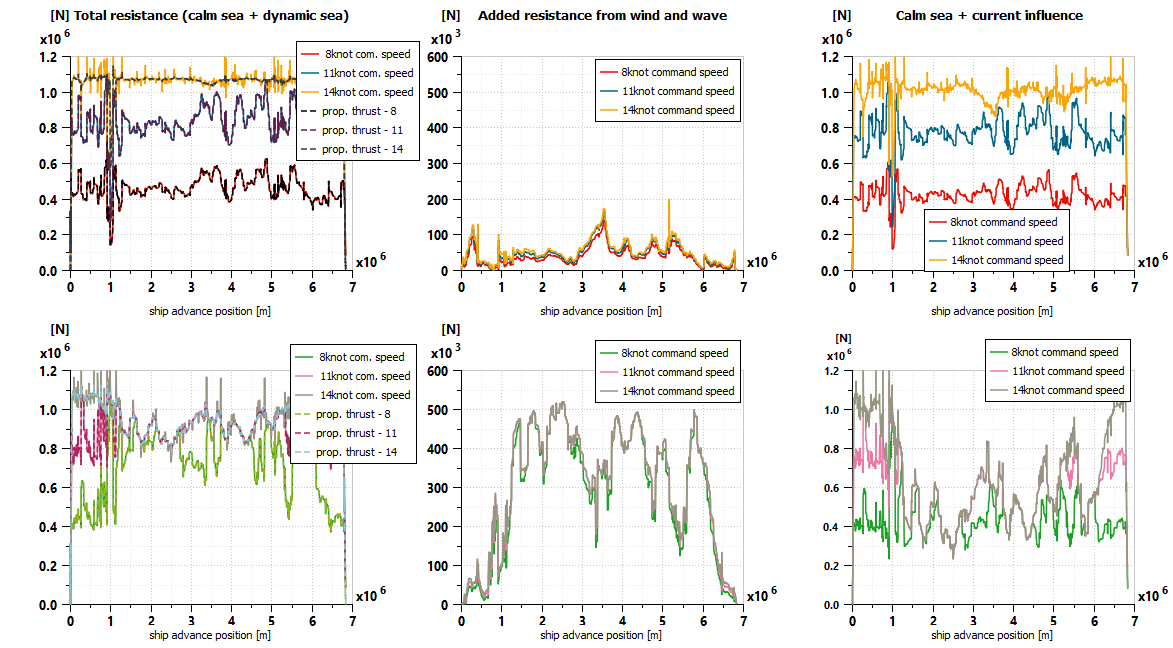
Figure 6: Sea resistances of different sources for good (top row) and bad weather conditions

The ship accelerations are computed by the resultant force on the ship divided by the mass of ship. The result force is the difference between the total resistance and propeller thrust. The forces acting on the ship are shown in Figure 6.

The travel time, total fuel consumption and CO2 emission are determined for the six simulations. Figure 7 shows how these evolve along the ship advance position. The varying speeds in the bad weather conditions are clearly visible in the travel time graph, as the slopes are not constant.

Results

The increase in travel time and average fuel consumptions are shown in the table.

Command speedWeather conditionTravel time [days]Travel time increaseFuel consumption [tonne]Fuel consump-tion increase
8 knotGood19.3Reference306.44Reference
8 knotBad20.03.6%466.3852%
11 knotGood14.1-26.9%419.7637%
11 knotBad17.4-9.9%519.6270%
14 knotGood12.4-35.7%520.4370%
14 knotBad17.0-11.7%543.377%

Get in touch?

Contact us if you’re interested in system simulation and the possible ways we can support you, or want to receive more information.

Contact us

Simcenter Amesim Training

To teach you and your team to fully exploit the capabilities of Siemens Digital Industries Software, we offer a proven and successful roadmap with different levels of training. In addition to this training, continuous access to extensive Femto Support is available. From seminars and introductory courses to customised and in-depth training courses, we always offer relevant content with the latest insights. You can read more about our Femto Academy on this page.


read more

Femto Snippit: combine graphs

If you want to show correlation of two separate inputs, it can be useful to show multiple graphs in one figure. This saves space and provides clarity in specific time/temperature/pressure indications, among other things. For convenience, we have created a short introductory video with an example of how to combine two graphs.


read more

About Simcenter Amesim

Simcenter Amesim is a fully integrated scalable simulation platform for modelling and analysing various types of systems with multiple domains. Simcenter Amesim enables engineers to assess and optimise the performance of systems, improving productivity. Amesim has an extensive set of libraries with components for various physical domains, such as components for electrical fluids and mechanical systems.


read more

July 20, 2022
get in touch

Do you need more information or want to discuss your project? Reach out to us anytime and we’ll happily answer your questions.

about us

At Femto Engineering we help companies achieve their innovation ambitions with engineering consultancy, software, and R&D.
We are Siemens DISW Expert Partner for Simcenter Femap, Simcenter 3D, Simcenter Amesim, Simcenter STAR-CCM+ and SDC verifier. Get in touch and let us make CAE work for you.

Privacy policy

×

Be ahead in FEA & CFD

Sign up for our newsletter to get free resources, news and updates monthly in your inbox. Share in our expertise!