Lid Driven Cavity Flow - Femto Engineering - Femto Engineering

Lid Driven Cavity Flow

In this installment of Validating the Fundamentals we will look at lid-driven cavity flows using the Simcenter Star-CCM. The aim is to validate the results with the experimental data. The data showed that the lid-driven cavity flow consists of a 2D 1m by 1m square. The top boundary is given a velocity of 1m/s in the positive x-direction. To validate the results of the lid-driven cavity flow the article by Ghia et. al. [1] is used as reference.

Geometry and Mesh

The domain consists of a 1m-by-1m square of which the top “lid” is given a tangential velocity of 1m/s in the x-direction. The simulation is computed for several Reynolds numbers, ranging from 100 to 10000. Because the Reynolds numbers used in the simulation go from laminar to turbulent flow, prism layers are added to keep the y+ value below 1 for all simulations. The mesh is not changed between simulations.

A mesh cell size of 1/256m is used. This leads to a total number of cells of 90,000 for the simulations.

Figure 1: Mesh

Setup

A steady 2-dimensional simulation is performed. One set of simulations is performed using a laminar setting, while two other simulations are performed using respectively the Spalart-Allmaras RANS model and the realizable k-ε- two-layer RANS model.

A gas with a constant density of 1kg/m³ is used. Since all other properties are fixed, the only free parameter for setting the Reynolds number is the dynamic viscosity, μ, which is therefore defined as μ=1/Re.

Results

For the comparison of the results, the simulations are compared with the experiments. In the experiments, measurements of the velocity were taken on the horizontal and vertical centre planes and the vorticity was measured on the moving top plane.

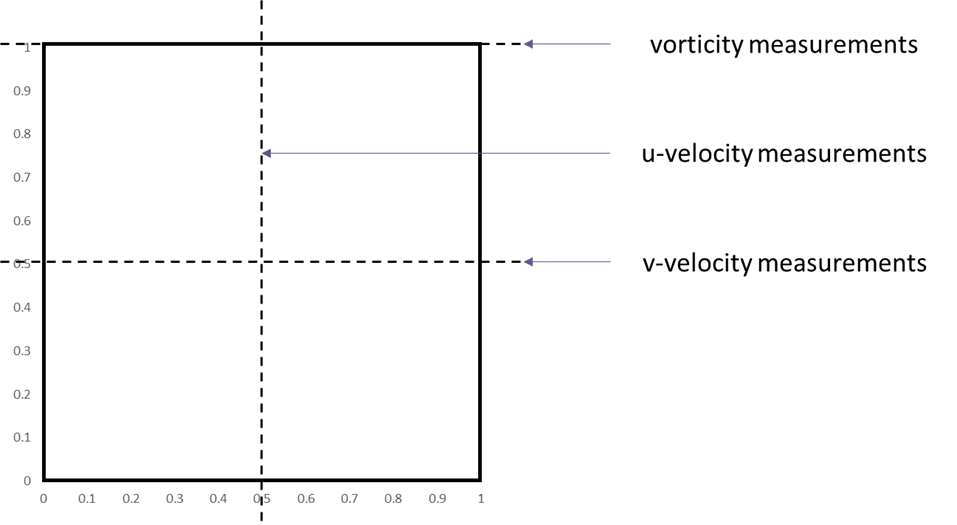
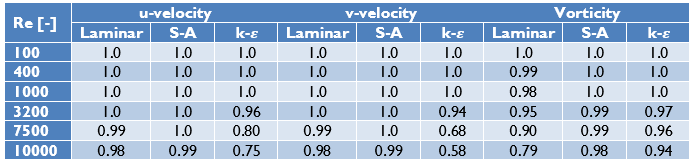
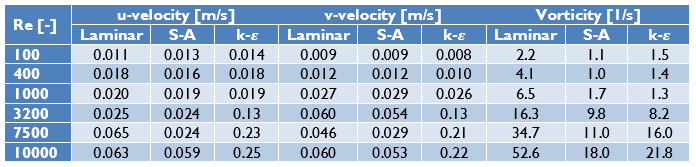
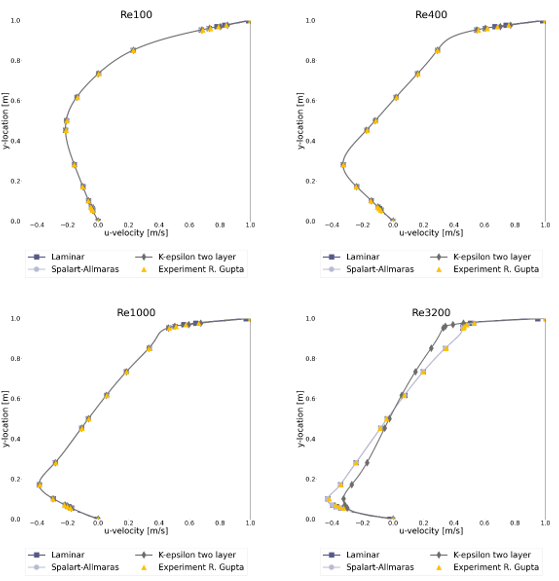
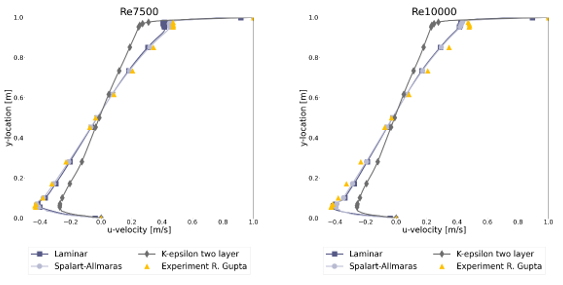
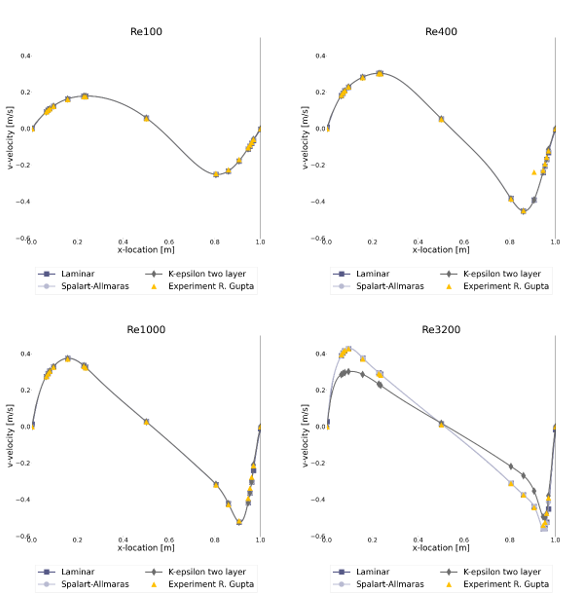
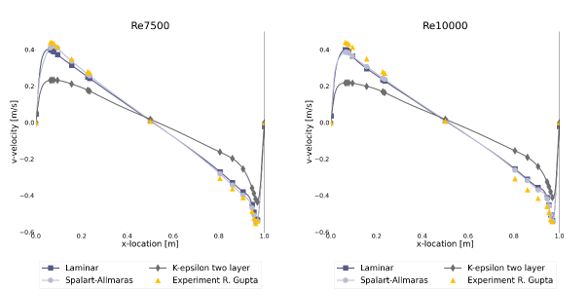
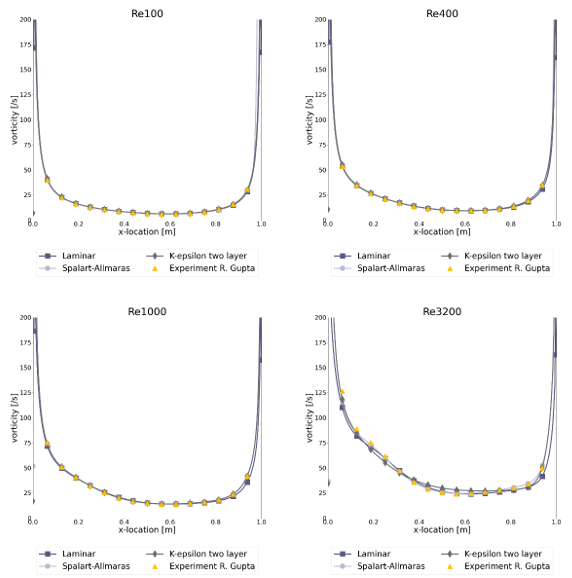
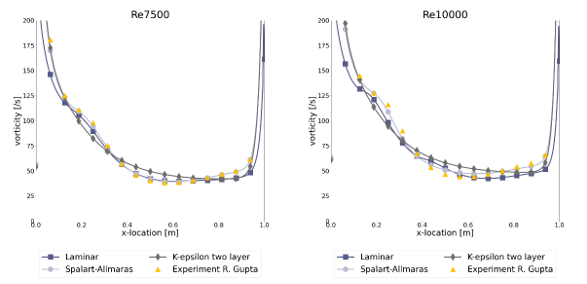
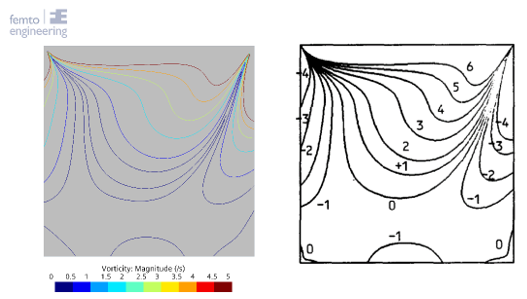
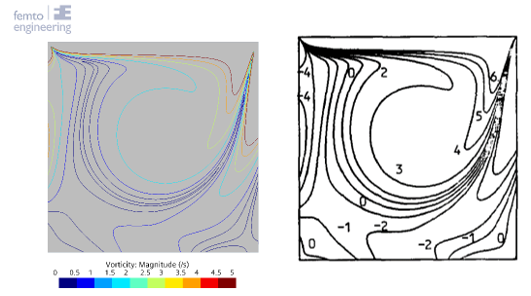
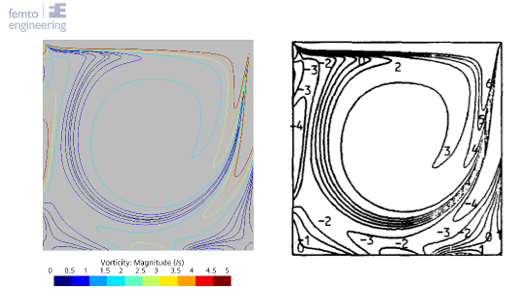
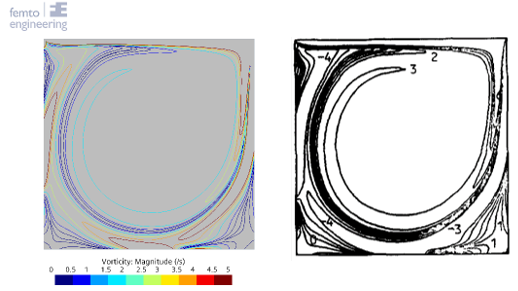
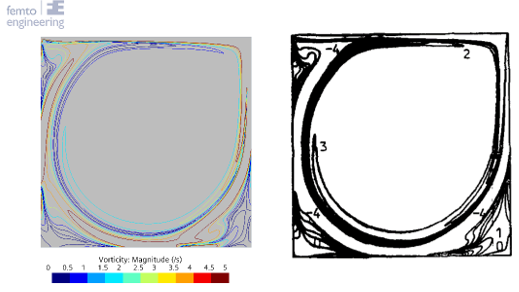
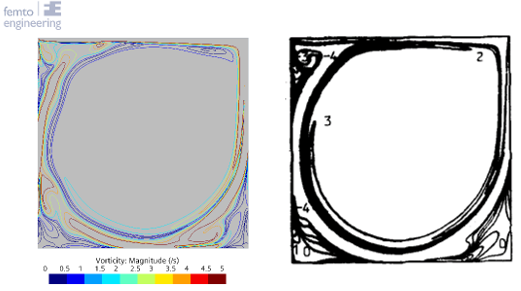
To compare the results the r-squared fit, Table 1, the maximum percentual error, Table 2, and the maximum absolute error, Table 3, have been determined for each of the Reynolds numbers and turbulence models. Furthermore, the figures show the comparison between the simulation and experimental results, with the u-velocity in Figure 1, the v-velocity in Figure 2 and the vorticity in Figure 3. Figure 4 till Figure 9 show the vorticity lines within the cavity for both the measurements and the simulation.

The results show a good fit for all simulations up to a Reynolds number of at least 1000. Beyond this number the flow transitions from a laminar to a turbulent regime, which decreases the fit due to 3D effects not taken into account into a 2D simulation. In general, the higher the Reynolds number the larger the difference between the experimental results and the simulations results.

For the u-velocity over the vertical mid-line of the cavity, the v-velocity over the horizontal mid-line and the vorticity the Spalart-Allmaras turbulence model is shown to have a good match up to the highest Reynolds number, with an error of 12.3%, 12.1% and 8.3% respectively at Re=10 000.

In general, the k-ε two-layer model performs the worst with an error of 51.9%, 50.4% and 18.7% for the u-velocity, v-velocity and vorticity at Re = 10 000.

Conclusions

In conclusion, Simcenter Star-CCM+ provides a good comparison between the experimental results of the lid-driven cavity flow the simulation results. The Spalart-Allmaras model gives the best results compared to the experimental results while the realizable k-ε two-layer model shows the worst results


Bibliography

[1] U. Ghia, K. N. Ghia and C. T. Shin, “High-Re Solutions for Incompressible Flow Using the Navier-Stokes Equations and a Multigrid Method,” Journal of Computational Phyiscs, vol. 48, pp. 387-411, 1982.


Table 1: r-squared fit between experimental and simulation results

Table 2: maximum percentual error between the experimental and simulation results

Table 3: maximum difference between the experimental and simulation results


Figure 1: u-velocity over the vertical mid-line


Figure 2: v-velocity over the horizontal mid-line


Figure 3: Vorticity over the moving lid

Figure 4: Vorticity in the cavity at Re = 100

Figure 5: Vorticity in the cavity at Re = 400

Figure 6: Vorticity in the cavity at Re = 1000

Figure 7: Vorticity in the cavity at Re = 3200

Figure 8: Vorticity in the cavity at Re = 3200

Figure 9: Vorticity in the cavity at Re = 10000

March 17, 2024
get in touch

Do you need more information or want to discuss your project? Reach out to us anytime and we’ll happily answer your questions.

about us

At Femto Engineering we help companies achieve their innovation ambitions with engineering consultancy, software, and R&D.
We are Siemens DISW Expert Partner for Simcenter Femap, Simcenter 3D, Simcenter Amesim, Simcenter STAR-CCM+ and SDC verifier. Get in touch and let us make CAE work for you.

Privacy policy

×

Be ahead in FEA & CFD

Sign up for our newsletter to get free resources, news and updates monthly in your inbox. Share in our expertise!