CFD waves project
FSID/SPH – STAR-CCM+ comparison of a 2D wave against a wall

FSID/SPH – STAR-CCM+ comparison of a 2D wave against a wall
In this article we will compare the impact forces and wave shape of a single wave clashing against a wall with data from two different papers. Both papers use different simulation methods for the liquid. One paper uses the Free surface Identification (FSID) numerical simulation code (non-linear 2D bi-fluid potential code developed by SLOSHEL JIP), the other paper uses the smooth particle hydrodynamics (SPH) method.
In the image below the domain of the simulation is shown. Note that the wave shown in the image is for visualization only, and not the wave used. The domain is 2-dimensional with a height of 12m and a length of 20m. An elliptic ramp is added with a vertical half-dimension of 2.8m and a horizontal half-dimension of 18m.
![Figure 1: wave domain [Etienne et. al. (2018)]](https://www.femto.eu/wp-content/uploads/2021/03/Setup.png)
Figure 1: wave domain [Etienne et. al. (2018)]
The wave is initialized in the domain using the equation: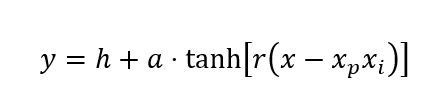
With the initial values used in the example papers, this gives the following equation:
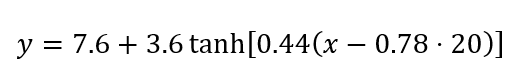
The value of 0.78 for the xp variable is determined using the FSID results. Changing this value changes the waves, with larger or smaller gas bubbles (or no gas bubbles at all) due to the presence of the elliptic bathymetry. In this case, the value of 0.78 will give us a wave with a large gas bubble clashing on the wall.
Simcenter STAR-CCM+ 2020.1 was used for this simulation. The volume of fluid (VOF) method was used, with the air modelled as an ideal gas and water modelled as a constant density fluid, with a density of 1000 kg/m3. Gravity is present, with a value of 9.81 m/s2 in negative y-direction. The gravity, in combination with the ramp on the bottom, generates the wave.
For the mesh, a 2-dimensional polyhedral mesh is used. The cells near the impact wall (between x = 0m and x = 4m) have a size of 2.5cm while the cells in the rest of the domain have a size of 5cm.
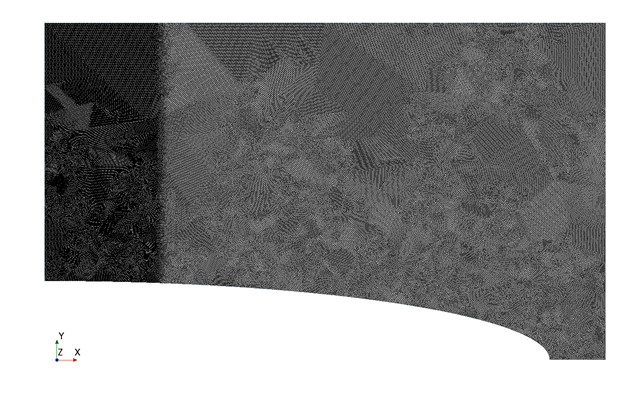
The area of interest for the wave impact is situated above a height of 4 meters and below 8 meters. Above 8 meter there is only air, without significant pressure changes. Between the 4- and 2.8-meter mark (2.8meter is the vertical half-dimension of the ramp) on the wall, water is present continuously. Because of this, no major pressure changes occur there in this simulation. Due to the above, these two areas are not evaluated.
In the two figures shown below, a comparison is made between our simulation performed in Simcenter STAR CCM+ 2020.1 and the simulation performed with SPH [Guilcher et al. (2013)]. The first pressure peak resulting from the STAR CCM+ simulation is located at the same location but results in a lower maximum pressure (4 bar versus 11 bar). However, decreasing the mesh size to 1cm in the area 0m < x < 4m increases the maximum pressure peak from Simcenter STAR CCM+ 2020.1 to 14 bar, indicating that the mesh size is important for the pressure peak.
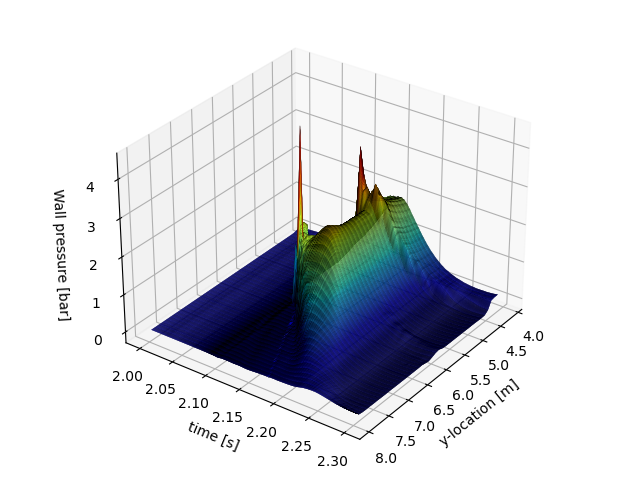
Figure 2: Pressure distribution on the wall as generated with Simcenter STAR CCM+ 2020.1
![Figure 3: Pressure distribution on the wall [Guilcher et. al (2018)]](https://www.femto.eu/wp-content/uploads/2021/03/result-3.png)
Figure 3: Pressure distribution on the wall [Guilcher et. al (2018)]
In the pressure figure, three peaks can be identified.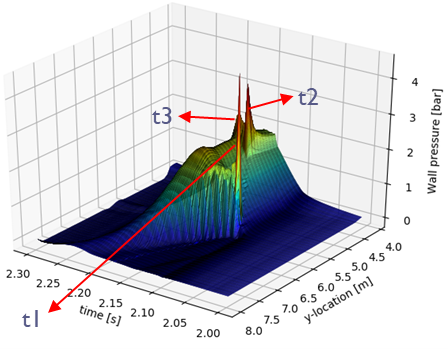
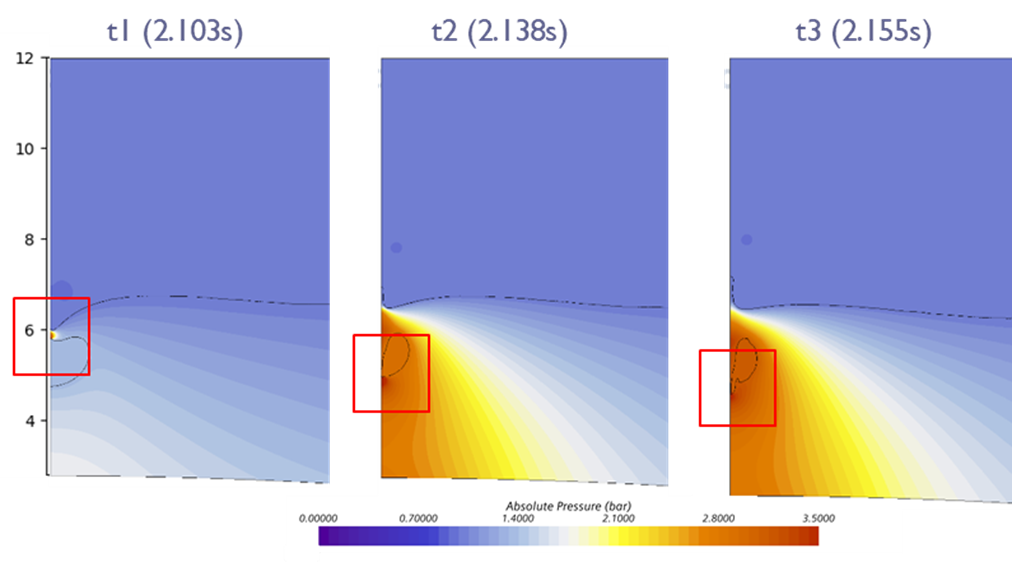
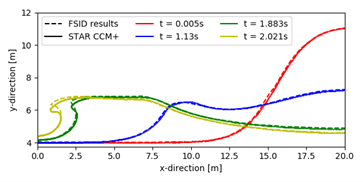
In the images below the waveshape from the FSID simulation [Etienne et. al. (2013)] and Simcenter STAR CCM+ 2020.1 are given. The waveshapes are comparable, however in STAR CCM+ the wave crest moves down more than is the case in FSID.
A close match in the wave shapes is found between FSID/SPH and STAR CCM+, with the wave generated by STAR CCM+ having a somewhat lower wave crest. The first impact pressure peak is somewhat lower as well, although this can also be due to the chosen mesh size.
Do you need more information or want to discuss your project? Reach out to us anytime and we’ll happily answer your questions.
At Femto Engineering we help companies achieve their innovation ambitions with engineering consultancy, software, and R&D.
We are Siemens DISW Expert Partner for Simcenter Femap, Simcenter 3D, Simcenter Amesim, Simcenter STAR-CCM+ and SDC verifier. Get in touch and let us make CAE work for you.
Sign up for our newsletter to get free resources, news and updates monthly in your inbox. Share in our expertise!