CFD Tuesday Knowledge: Battery natural convection - Femto Engineering - Femto Engineering

CFD Tuesday Knowledge: Battery natural convection

In this article we will use a simplified model to model the natural heat convection of a battery in a closed room. The information used in this article is based on the paper “3D CFD modeling and experimental testing of thermal behavior of a Li-Ion battery by E. Gümüsşu, Ö. Ekici and M. Köksal, Applied Thermal Engineering 120 (2017) 484-495”.

Geometry

Figure 1: Geometry

In this article a Panasonic NCR18650B battery is simplified into a cylinder with a diameter of 17.4mm. Around this cylinder, a shell is created with a thickness of 0.4mm, giving the battery a total diameter of 18.2mm. The height of the battery is 65mm.

The battery is placed in the middle of a domain with a size of [LxWxH] = [1m, 1m, 1m].  The walls of the domain are given the adiabatic boundary condition.

Mesh

The battery and shell are modelled as a solid, while the surrounding domain is modelled as a gas. Using the polyhedral mesher in Simcenter STAR CCM+ 2021.1, a conformal mesh is generated between the solid and gas domains. A thin mesher with four thin layers is used for the shell, to limit the number of cells in the domain. On the shell, prism layers are added to correctly resolve the thermal boundary layer and the heat transfer into the domain. Interfaces between the battery, the shell and the domain allow for convection to take place between the three parts.


Figure 2: Mesh in the domain, shell and battery

Figure 2: Mesh in the domain, shell and battery

Physics

Three physics continua are generated in this simulation. One for the air, one for the battery and one for the shell. The air is modelled as a laminar ideal gas. Because heat transfer is present, the energy equation is added to the governing equations and are solved by means of the segregated fluid model. To model the correct heat distribution throughout the domain the gravity model is used as well. The battery and the shell are both modelled as solids with the segregated solid energy model.

Based on the information from the above-mentioned paper (Gümüsşu, Ekici, & Köksal , 2017) material settings for each of the three parts are implemented as shown in the table below. The heat conductivity of the battery is decomposed into the radial component (3 W/m-K) and the tangential and axial components (28.05 W/m-K). The parameters for the shell are an averaging of the properties for aluminum and PVC, as was used in the paper.

Table 1: material parameters (Gümüsşu, Ekici, & Köksal , 2017)

The model is initialized using a temperature of 25˚C.

Heat source

For the battery, a total heat source is used, where the heat production is calculated using the following equation:

In this equation I is the charge/discharge current in Ampere, OCV is the open circuit voltage, V is the voltage of the battery, T_b  is the temperature of the battery and \frac{dOCV}{dT}  is an entropic term in V/K.

For the heat production of the battery, the test data from (Gümüsşu, Ekici, & Köksal , 2017) is used. In the three tables below the tested data for OCV, V and  \frac{dOCV}{dT} is shown as function of the discharge rate of the battery. The effect of the temperature of the battery is neglected for the OCV and \frac{dOCV}{dT}  parameters in this simulation, which means that the discharge rate is a function of only time.

The current of the battery is 3.25A, which will be scaled depending on the discharge rate to get the parameter for I. The battery temperature term in the equation is implemented directly from the battery temperature in the simulation.


Figure 3: Input for the heat generation equation (Gümüsşu, Ekici, & Köksal , 2017)

Results

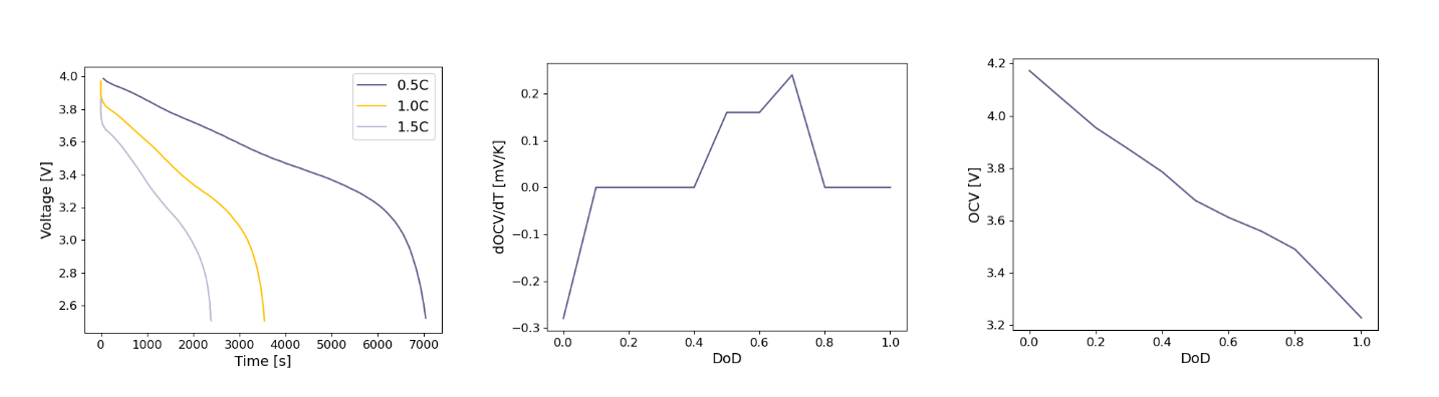
Three different discharge rates have been simulated to be compared to the test data. The discharge rates are 0.5C (I = 1.625A), 1.0C (I = 3.25A), and 1.5C (I = 4.875A). In the three plots below the temperature increase of the batteries over time is given and compared to the experimental data. In this plot it is visible that a reasonable comparison can be made for 1.0C and 1.5C but the difference is quite large for a discharge rate of 0.5C.

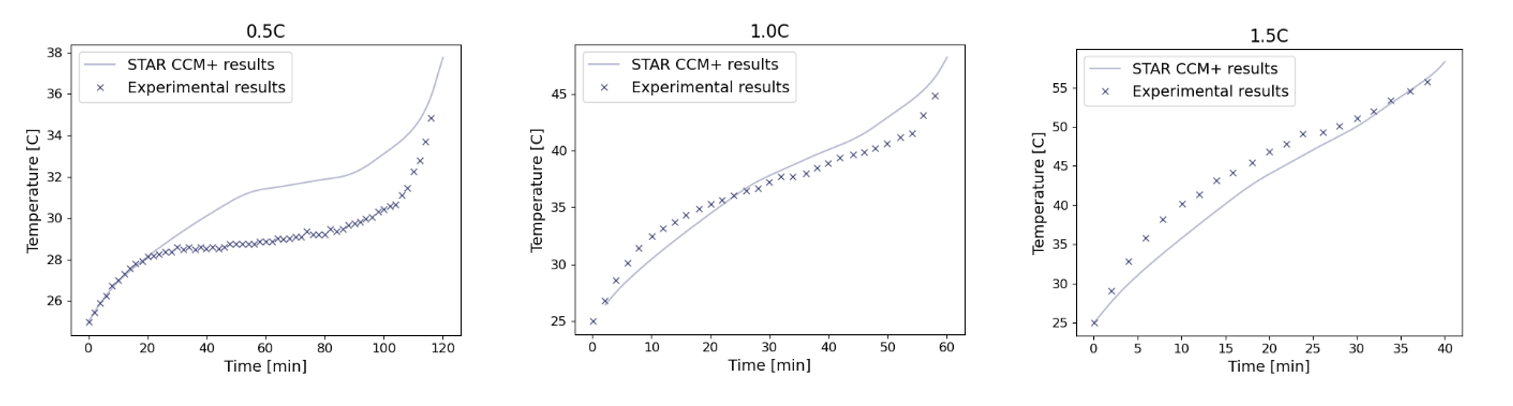
Figure 4: Experimental results versus simulation results

In the table below the error in temperature at the last (measured) timestep and the maximum error is given. From this table it can be concluded that the best overall fit is found for a 1.0C discharge rate. The error for the final temperature is at most 3.5%, while the maximum error within the domain is found for the 1.5C discharge rate with an error of 11.6%.
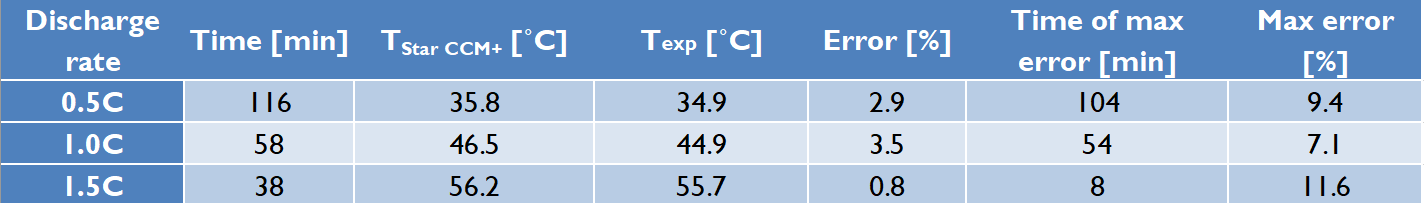
 

Table 2: Results

In the three plots below, the temperature increases over time compared to the experimental results can be seen. However, this time the heat production, Q, is added on the right axis. From the heat production it can be seen that the CFD simulation has the tendency to react slower to changes in the heat production compared to the test.

Especially with a discharge rate of 0.5C this causes the flat part of the curve (between 40 and 100 minutes) of the simulation to lie at a much higher temperature compared to the test. However, this also causes the low error in the final temperature, because the slope of the curve is lower at the end for the simulation compared to the test.

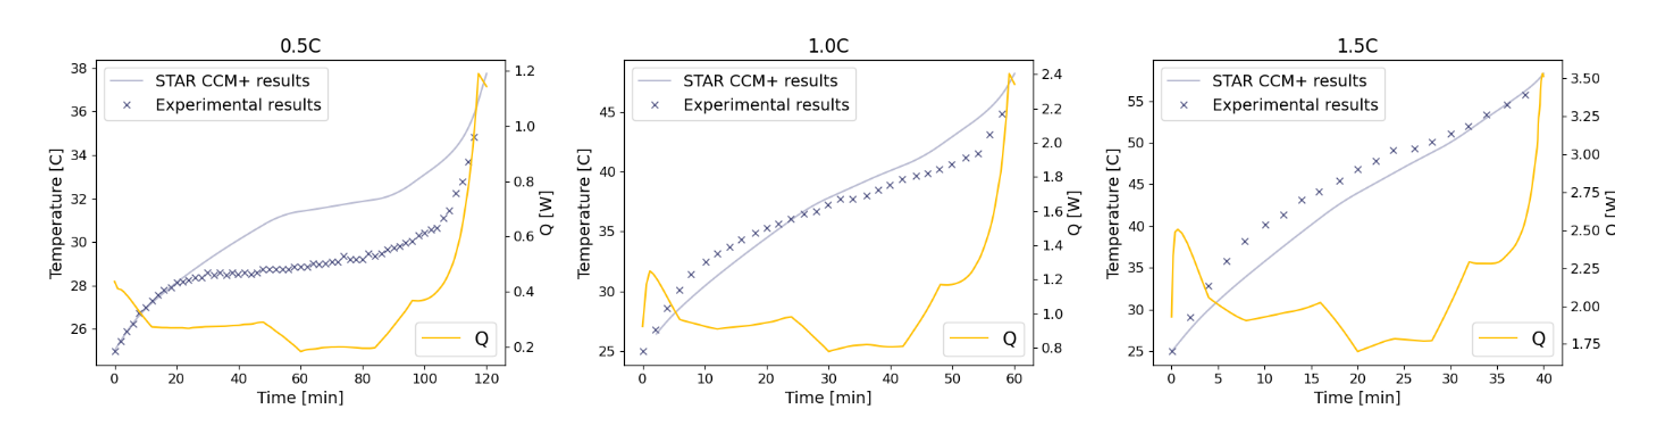
Figure 5: experimental results with simulation results, with the addition of the heat generation


Conclusion

Using the results from the test a reasonable comparison between the test temperature and the simulation temperature. The match between test and simulation is the best for a discharge rate of 1.0C.
Below an animation is shown for the temperature increase in the battery for different discharge rates.

Bibliography

Gümüsşu, E., Ekici, Ö., & Köksal , M. (2017). 3-D CFD modeling and experimental testing of thermal behavior of a Li-Ion battery. Applied Thermal Engineering, 120, 484-495.

June 8, 2021
get in touch

Do you need more information or want to discuss your project? Reach out to us anytime and we’ll happily answer your questions.

about us

At Femto Engineering we help companies achieve their innovation ambitions with engineering consultancy, software, and R&D.
We are Siemens DISW Expert Partner for Simcenter Femap, Simcenter 3D, Simcenter Amesim, Simcenter STAR-CCM+ and SDC verifier. Get in touch and let us make CAE work for you.

Privacy policy

×

Be ahead in FEA & CFD

Sign up for our newsletter to get free resources, news and updates monthly in your inbox. Share in our expertise!