Solving Exhaust Gas Propagation Problems in the maritime Industry Using CFD - Femto Engineering - Femto Engineering

Solving Exhaust Gas Propagation Problems in the maritime Industry Using CFD

The exhaust on a ship can be positioned in several different locations. Some of these locations are above water, on top of the ship using chimneys, or in the hull of the ship above the waterline. Other times the exhaust is located below the waterline of the ship. Both locations have their own pros and cons. Problems related to above-water exhaust locations (chimneys) are mainly related to smells and air quality. Air quality can be defined on a spectrum. Slight smells might be the least disruptive, but very undesirable, while on the other end of the spectrum you have air quality that might result in unsafe working conditions. The main issue related to underwater exhaust positions, as well as exhaust positions on the hull above the waterline, is stains. When the exhaust air is not sufficiently deflected from the hull it might lead to visible soot deposition on the hull.

Exhaust position and CFD analysis

The type of CFD analysis required to model these kinds of exhaust systems is directly related to the exhaust location. When the exhaust is positioned below the waterline, or directly above it, the waves generated by the ship will have a large impact on the location of the stains. In this case a single scenario is often enough the determine the impact of the exhaust gases on the stains on the hull. These simulations will consist of two steps, where first the waves around the hull are solved using a transient VOF simulation, a more in-depth article about these types of simulations can be found here. In the second step the exhaust gases are added to the simulation.
If the exhaust is located on top of the ship, the type of simulation is different. In this case the waves are not important to the distribution of the exhaust gases around the ship. However, the wind speed and direction is of importance. In this case a steady CFD simulation can be performed,  with the exhaust gases  added directly to the simulation. However, oftentimes several wind directions need to be modelled in order to find the worst case scenario.
The simulation times for chimney exhausts  are typically much lower as the required steady state simulations require less simulation time than transient wave simulations (steady versus transient). However, the total amount of simulations will be much higher. Luckily, using the automation features within Simcenter STAR CCM+, the rotation of the wind and the required mesh changes for each wind direction can be automated. This means that in the end, all wind directions can be simulated without much interference of the engineer. This means that for both cases (underwater exhaust as well as chimney exhaust) the overall simulation time is the limiting factor.

Solving methods

In this section, two methods to solve the exhaust gases will be explained in a more in-depth manner. Note that these two methods are not the only methods to solve exhaust gases within Simcenter STAR CCM+.
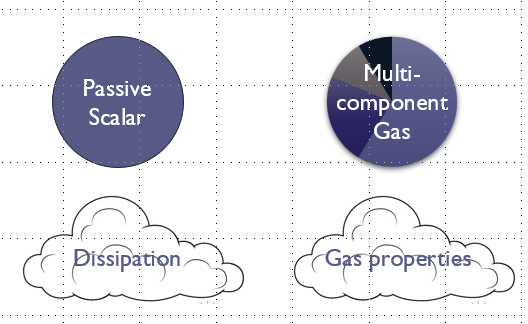
The image below gives a schematic overview of the two methods to solve exhaust gases within Simcenter STAR CCM+. The first method makes use of a (single) passive scalar. In this case the entire exhaust gas is encapsulated within this passive scalar. The dispersion of the exhaust gas through the domain is dependent on the set diffusivity of the passive scalar as well as the turbulent Schmidt number. This method means very little pre-processing work, since a single passive scalar is set and added to the inlet within the domain, where the exhaust gases are added to the domain.
The second method makes use of a multi-component gas. In this case the gas is divided into each of the exhaust components (e.g. air, CO, CO2, NOx, SOx, soot particles). Each gas component is given the corresponding material properties as well as the correct mass fraction (or mole fraction) within the multi-component gas. This method thus has much more pre-processing work, since each component needs to have the correct values added. The dispersion of the exhaust gas will then be dependent on the gas properties of each of the components within the exhaust gas, making the method more realistic.

Once post-processing starts the multi-component gas method requires much less work, since each of the gas components is already included as a field function within the simulation. On the other hand, the passive scalar method will require much more postprocessing time because the correct percentage of the total exhaust gas that each component (air, CO2, CO, NOx, SOx, Soot) entails needs to be known and added within a field function before the separate components can be visualized. However, if only the overall behaviour of the exhaust gas is needed, then the passive scalar method will give a much quicker result, since no information is needed about the separate components.

Example

To demonstrate the differences between the two methods we have created a test-case. The test-case consist of the hydrograaf (or pakjesboot). In this simulation 2 exhaust channels are present (as visualized in red in Figure 1), as well as 4 cabin inlets. It is undesired to get exhaust gas within the cabin, therefore we are interested in how much of our exhaust gas reaches the inlets of the cabin.
Figure 1: cabin inlets and exhaust outlets on the hydrograaf

Each cabin inlet has an air intake of 2kg/s, while each of the two outlets have a velocity of 1.28m/s and an exhaust temperature of 300C. An atmospheric boundary layer makes sure that the velocity of the wind around the ship is modelled correctly, where the wind speed is taken as 3.5 m/s, with an angle of 30° (note that this is a combination of the velocity of the ship and the wind velocity coming at an angle). This angle allows us to determine the exhaust gases that will come into the cabin through the two starboard inlets (shown in light and dark purple in Figure 2).
Even though, as described above, this simulation can be done in steady-state, we have decided not to do so for this example. This decision was made in order to allow us to not only compare the equilibrium situation for both the passive scalar as well as the multi-component gas but to also determine the behaviour of both methods over time.
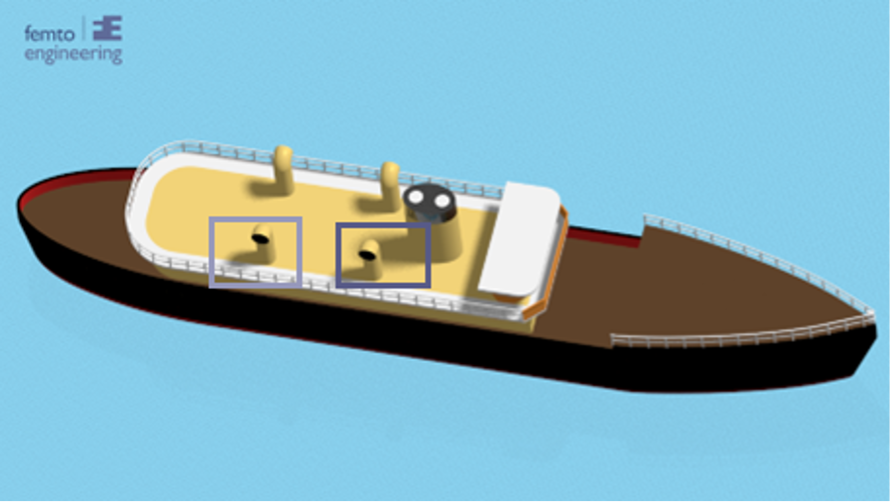
Figure 2: cabin inlets of interest

In Figure 3 the results of the simulation are shown for both the passive scalar method as well as the multicomponent gas method. In figure Figure 3 (top) the total amount of CO2 over time flowing in the cabin is shown. This table indicates that the total amount of CO2 entering the cabin greatly exceeds safe values within the first 20 seconds, but afterwards reduces significantly. Note that this table shows that added amount of CO2 compared to a baseline value of 0. Since the baseline amount of CO2 in the air is already around 400ppm, this value should be added to the table to correctly conclude if an unsafe working environment is created.
This table indicates that if the ship starts moving with a windspeed of 3.5m/s which comes under an angle of 30° , after which the wind speed reduces while the ship increases in speed to keep the angle of 30° this graph will give a good indication of the climate within the cabin. After a minute the total amount of CO2 in the cabin is still reducing, which means that once the ship reaches a constant velocity, the cabin climate will be sufficient for people to be there.
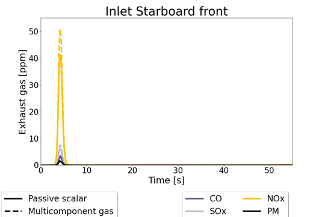
In Figure 3 (middle) and Figure 3 (bottom) the total amount of the other exhaust gas components for both simulation methods is shown. From these graphs it can be concluded that the passive scalar method under predicts the peak values of the exhaust gases entering the cabin. However, after a minute the values found by the passive scalar method are equal to the values found by the multicomponent gas method. Therefore, it can be concluded that if an equilibrium value is needed, that both methods work equally well. However, if peak values are very important, the multi-component gas method is better.
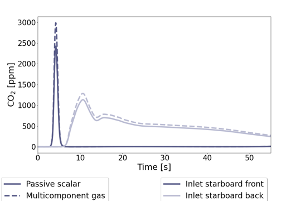
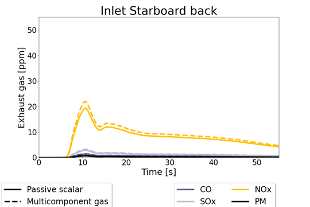


Figure 3: CO2 flowing into the cabin inlets (top), exhaust gas components flowing into the starboard back cabin inlet (middle), exhaust gas components flowing into the starboard front cabin inlet (bottom).

In Figure 4 the difference between the multicomponent gas and the passive scalar at the inlet height is shown. The difference in CO2 at these heights and this simulated time is very minor.

Figure 4: CO2 values at the cabin inlet height after a minute of simulated time

Conclusion

In conclusion, if you are interested in the peak values of exhaust gases over time at certain spots on the ship it would be best to use a multicomponent gas. Furthermore, if you are interested in the specific gas components, the multicomponent gas method is better as well. This is because it takes more work up front, but is less error prone once post processing, since all gas component settings are set. The passive scalar method is much stronger in steady simulations or (long) transient simulations where only the general behaviour of the exhaust gas is of interest.

November 18, 2025
get in touch

Do you need more information or want to discuss your project? Reach out to us anytime and we’ll happily answer your questions.

about us

At Femto Engineering we help companies achieve their innovation ambitions with engineering consultancy, software, and R&D.
We are Siemens DISW Expert Partner for Simcenter Femap, Simcenter 3D, Simcenter Amesim, Simcenter STAR-CCM+ and SDC verifier. Get in touch and let us make CAE work for you.

Privacy policy

×

Be ahead in FEA & CFD

Sign up for our newsletter to get free resources, news and updates monthly in your inbox. Share in our expertise!